Africa’s Energy Transition Numbers Tell the Truth and Hide It
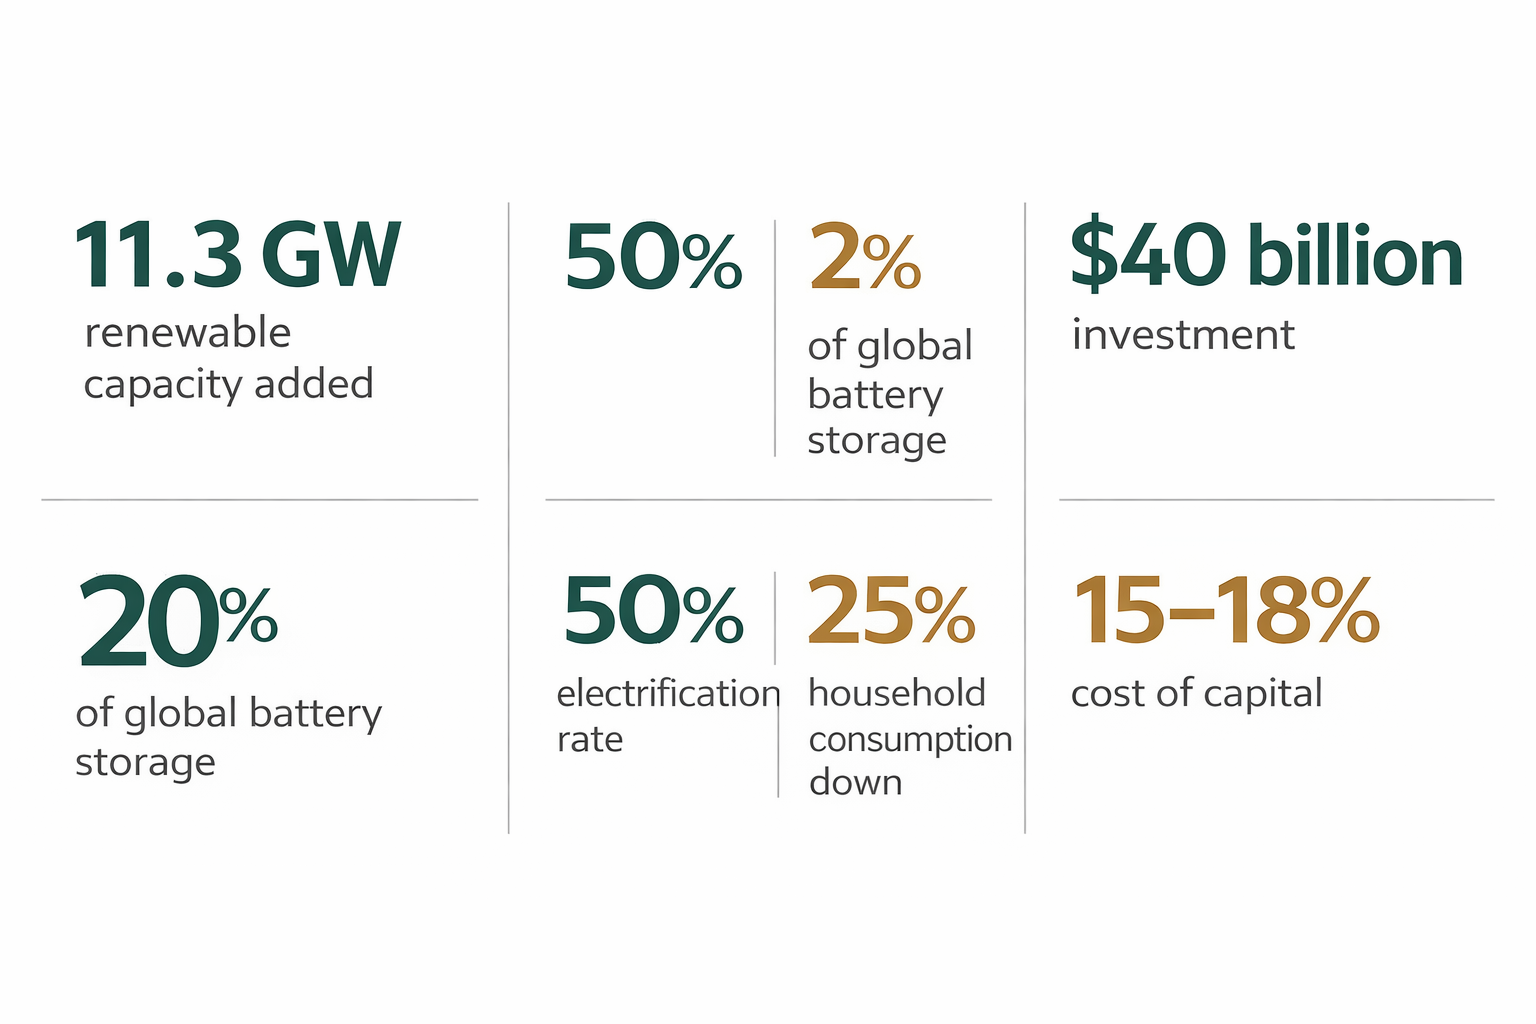
Every major institution tracking Africa's energy transition in 2026 has data to celebrate. IRENA's Renewable Capacity Statistics 2026 confirms Africa added 11.3 gigawatts of renewable capacity in 2025, its highest annual growth rate on record, at 15.9 percent.
The IEA reports that sub-Saharan Africa's electricity access rate has risen from 30 percent of the population in 2012 to 50 per cent in 2024. Clean energy investment flowing into the continent reached nearly $40 billion in 2024, up from $17 billion in 2019. These are headline figures, and every one of them is accurate. They are also taken in isolation, misleading.
The way Africa's energy transition is measured in 2026 has a structural bias towards what is visible and countable. Capacity additions are visible, and access connections are countable. Investment volumes appear in annual reports. What isn't measured with equivalent rigour and what the headline figures consistently obscure is the quality of what is being built, the reliability of what is being delivered, and the economic conditions under which capital is being deployed.
The result is a picture of the transition that is more optimistic than reality warrants in some dimensions and more pessimistic than reality warrants in others. What Africa's energy transition actually looks like in 2026 depends entirely on which numbers you choose to read. This piece places three pairs of data points side by side: the figure most commonly cited and the figure that complicates it, and examines what the gap between them reveals.
Pair one: renewable capacity versus delivered electricity reliability
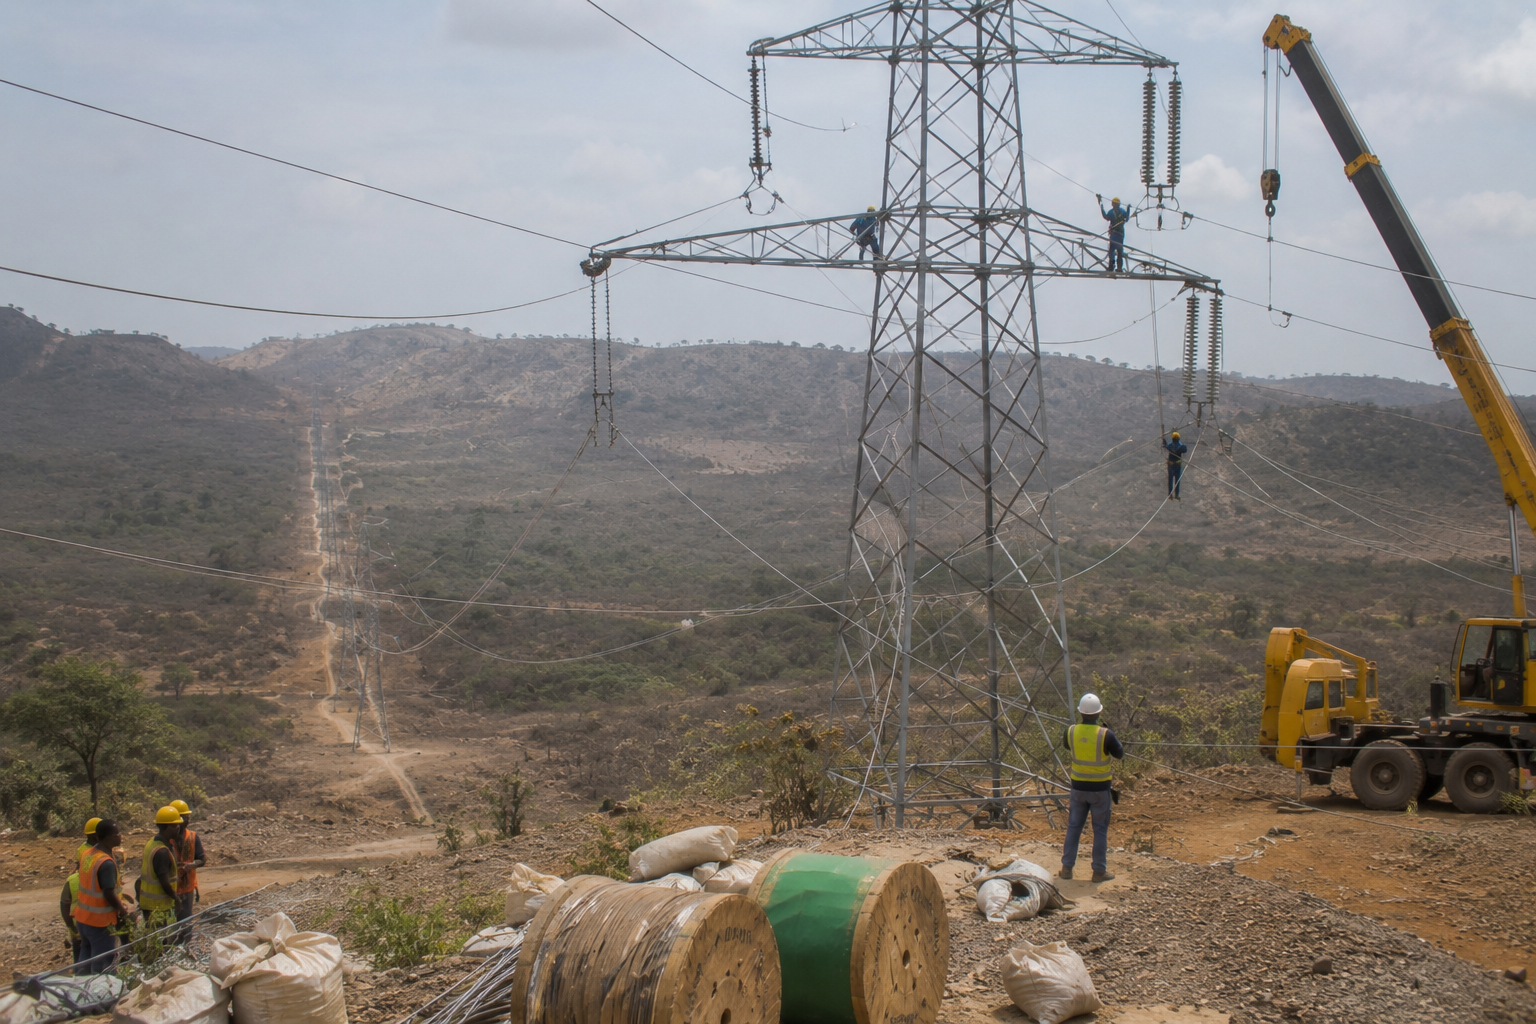
The headline: Africa added a record 11.3 gigawatts of renewable capacity in 2025, a 15.9 percent increase according to IRENA's Renewable Capacity Statistics 2026. Total renewable capacity across Africa has now reached 82 gigawatts. Solar and wind together accounted for 96.8 percent of all net renewable additions globally last year. The pipeline of projects across Morocco, Egypt, South Africa, Kenya, Ethiopia, and Namibia is real and expanding.
The complication: installed capacity is a measure of what a system can theoretically produce under ideal conditions, and not a measure of what is reliably delivered to homes, factories, or grid users. The gap between those two figures is determined by transmission infrastructure, storage, grid management capability, and system integration and throughout most of Africa, that gap is substantial and widening.
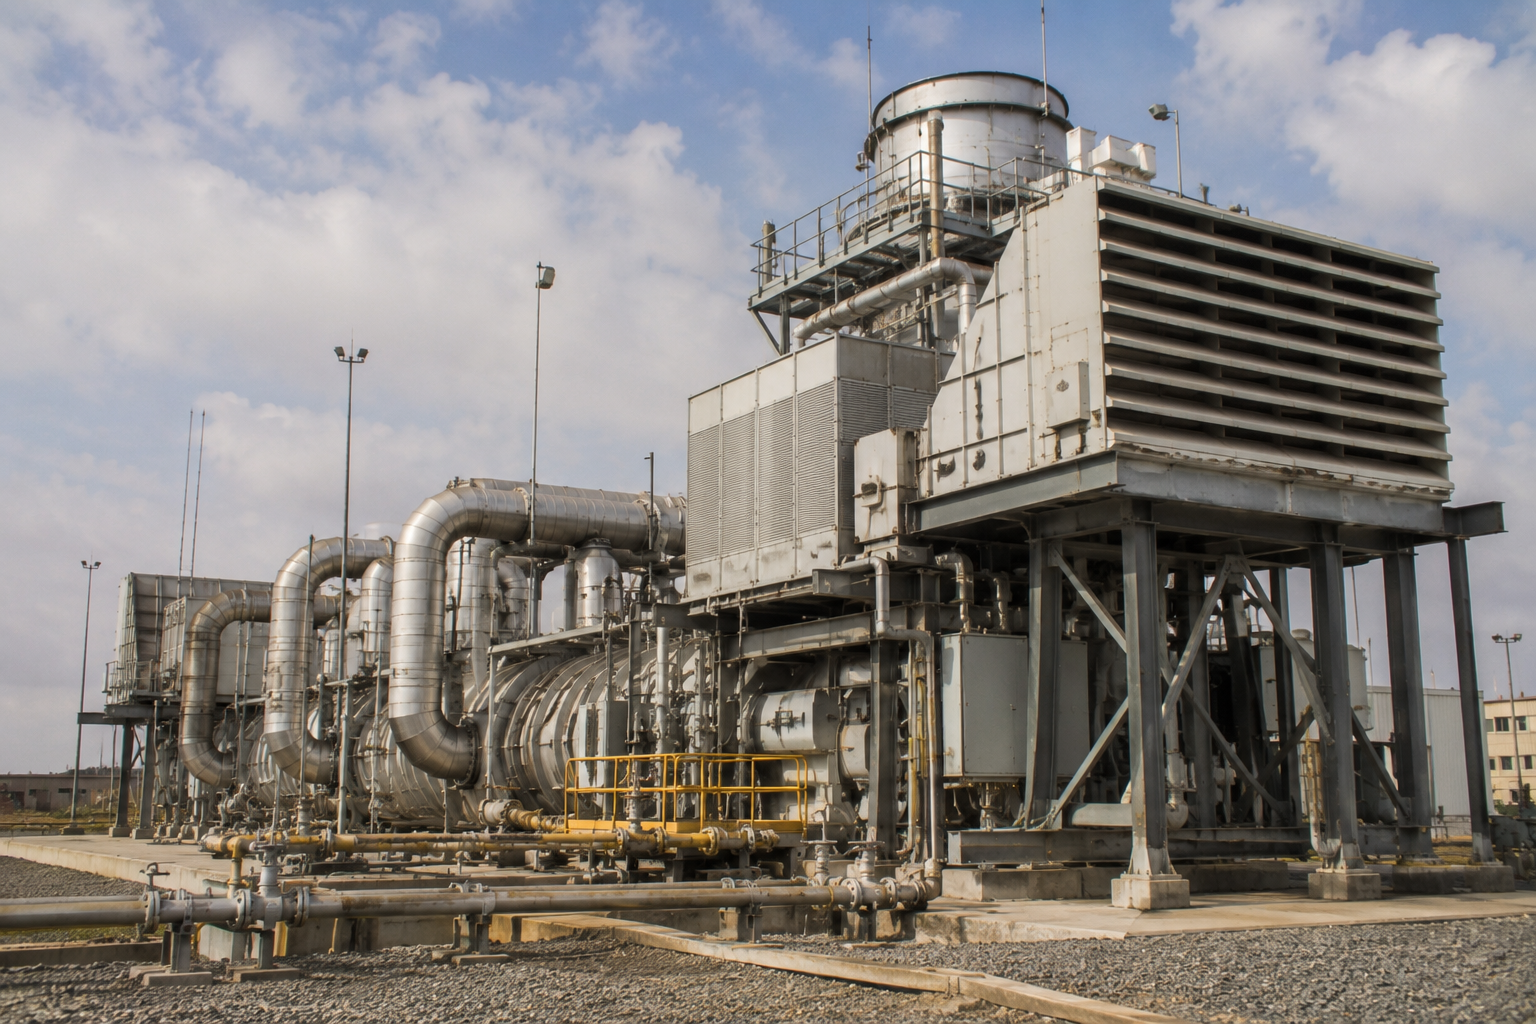
Africa's battery storage capacity sits at approximately 2 percent of the global total as of 2025. Solar generation is intermittent by definition, producing nothing after sunset and significantly less during cloud cover. Without storage or complementary baseload, variable renewable capacity cannot provide the continuous, dispatchable supply that industrial users and household reliability require.
Curtailment, the forced reduction of renewable output because the grid can't absorb it, is an increasing reality in systems where renewable deployment has outpaced transmission investment. Africa's estimated transmission and distribution gap exceeds $100 billion over the coming decade, according to World Bank analysis. Generation headlines and grid reality are moving at different speeds, and the gap between them is where the transition either delivers or stalls.
Pair two: electrification rate versus household consumption per capita
The headline: sub-Saharan Africa's electrification rate has risen from 30 percent of the population in 2012 to 50 per cent in 2024. That represents tens of millions of new connections, a genuine and hard-won achievement. In 2024, 6.8 million new connections were made across sub-Saharan Africa, an 11 percent increase on 2023. Some countries Côte d'Ivoire, Kenya, and Mozambique, have demonstrated that ambitious electrification programmes can produce sustained results.
The complication: access is a binary measure. It records whether a household has a connection; but doesn'tmeasure whether it is sufficient, affordable, or reliable enough to support productive economic activity. And the IEA's data on household electricity consumption in sub-Saharan Africa reveals a finding that should fundamentally alter how electrification progress is discussed: despite the electrification rate rising from 30 to 50 percent over the past decade, average household consumption per capita has fallen by approximately a quarter over the same period.
The mechanism is straightforward. Electricity tariffs across the region have risen faster than household incomes. Newly connected households, typically in rural areas with very limited income consume well below the regional average and remain below it for years after connection. The expansion of electrification in areas of extreme affordability constraint is simultaneously a social achievement and a statistical artefact: it raises the access rate whilst diluting average consumption.
An energy transition that counts new connections without measuring what those connections actually deliver isn't measuring the transition at all. The IEA's financing for electricity access analysis confirms that fewer than 19 million people gained access in both 2023 and 2024, down from 23 million in 2019, and that progress remains below pre-pandemic levels in 27 countries across the region. The access headline is improving, but the reality it describes is more complicated.
Pair three: investment volume versus cost of capital
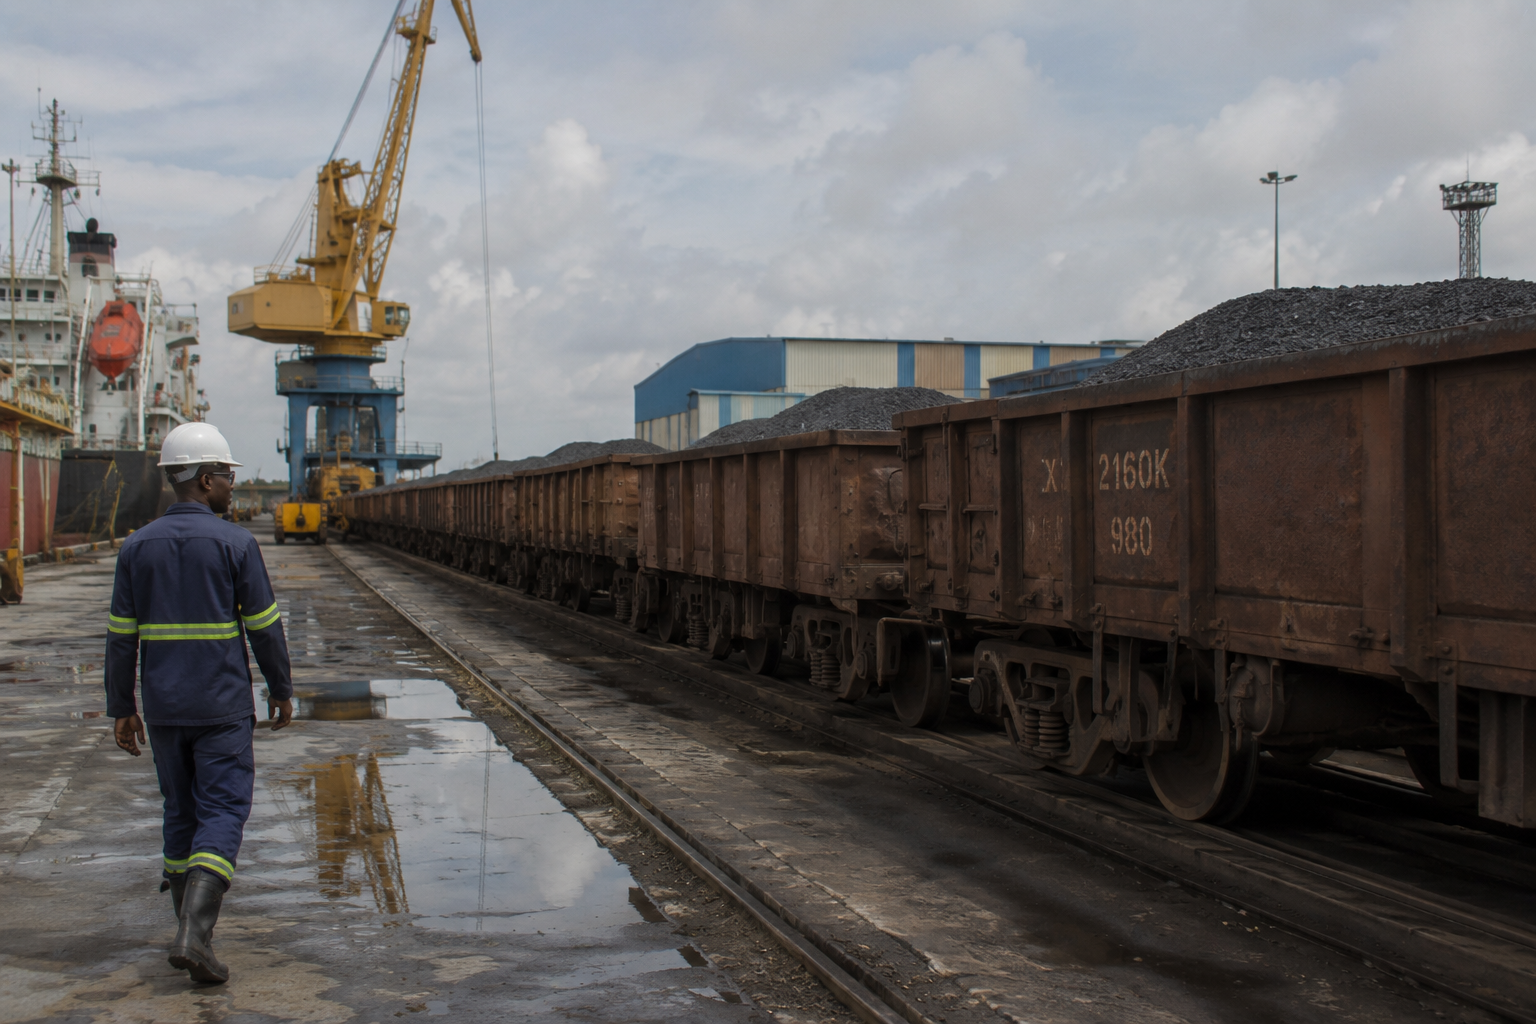
The headline: clean energy investment in Africa reached nearly $40 billion in 2024, up from $17 billion in 2019. The IEA's World Energy Investment 2025 report documents this increase as evidence of growing private sector engagement. Blended finance mechanisms, development finance institution activity, and the declining cost of solar hardware have collectively increased the volume of capital reaching African energy projects. The number is real.
The complication: investment volume and investment affordability are different measures, and in Africa's case, they move in opposite directions. Africa receives 2 percent of global clean energy investment despite hosting 20 percent of the world's population and some of the strongest renewable resource endowments on earth. The reason isn't a shortage of project opportunities, but the cost at which capital reaches those projects.
The average weighted cost of capital for clean energy projects in Africa runs at 15 to 18 percent, compared with 2 to 5 percent in Europe and the United States, a differential documented by the Columbia Climate School and confirmed by the Clean Air Task Force's analysis of weighted average cost of capital across African countries.
At these rates, the $40 billion flowing to Africa isn't comparable to $40 billion flowing to a European market. It carries a debt service burden that shapes what gets built, what gets repaid, and what fiscal cost falls on governments and utilities in the years after the ribbon is cut. Total energy investment across Africa has fallen by a third over the past decade, driven by declining fossil fuel spending that hasn't been fully replaced by clean energy flows. More capital is reaching Africa's clean energy sector than a decade ago, but at a price that constrains what it can achieve.
What the data, read together, actually shows
Placed side by side, the three pairs of data points produce a picture of Africa's energy transition that is more complex and more honest than either the optimistic or pessimistic readings that dominate external commentary.
The optimistic reading record capacity additions, rising access rates, growing investment flows which is incomplete though accurate. It describes real progress in the indicators that are measured most consistently, whilst the indicators that would complicate the picture per capita consumption, storage depth, effective cost of capital are reported less prominently and incorporated into policy narratives less reliably.
The pessimistic reading 600 million people still without electricity, structural financing barriers, persistent grid failures is also accurate but also incomplete. It describes real constraints while understating the genuine momentum in solar deployment, the structural shift in hardware costs that has made distributed solar economically viable across a far wider set of markets than a decade ago, and the policy architecture in some countries that has produced sustained, measurable progress.
Africa's energy transition in 2026 is neither on track nor failing. It is proceeding at a pace and in a direction that reflect the underlying institutional, financial, and political conditions of the continent, conditions that are themselves changing, unevenly and at different speeds across different markets and different segments of the energy system.
The countries that have made the most progress, South Africa, Kenya, Morocco, Egypt, and Ethiopia, have done so by building the institutional infrastructure that makes project delivery possible: regulatory frameworks, procurement processes, utility reform programmes, and in some cases the political will to accept tariff structures that allow utilities to remain financially viable.
The countries that have made least progress aren't failing because they lack renewable resources or because the technology is unavailable. They are failing for the same reasons that their energy systems have always underperformed: institutional fragility, fiscal constraint, and a financing architecture that prices the transition beyond their reach.
The question that should drive Africa's energy transition discourse in 2026 isn't whether the continent is transitioning. It demonstrably is, in aggregate. The right question is whether the transition is being measured in ways that can identify when it is failing the people it is meant to serve and whether the institutions that control the capital and shape the policy are responding to the real indicators or to the convenient ones.